Container for the scroll indicator
(Will be hidden in the published article)
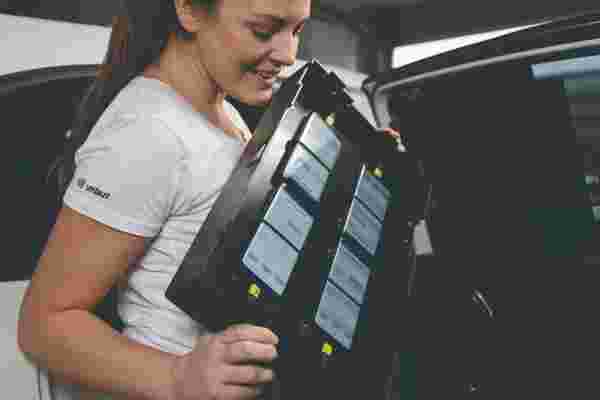
Each drive test vehicle carried eight smartphones for conducting the voice and data tests.
The umlaut connect Mobile Benchmark in the Netherlands comprises of the results of extensive voice and data drive tests and walk tests as well as a sophisticated crowdsourcing approach.
DRIVE TESTS AND WALK TESTS
The drive tests and walk tests in the Netherlands took place between February 1st and February 11th, 2022. All samples were collected during the day, between 8.00 a.m. and 10.00 p.m. The network tests covered inner-city areas, outer metropolitan and suburban areas. Measurements were also taken in smaller towns and cities along connecting highways. Two cars conducted the drive tests in the Netherlands. The connecting routes between the cities and towns alone covered about 3362 kilometres in total. In addition, the cars covered 2180 km while driving through the cities and 440 km while driving through the smaller towns. Overall, the vehicles together covered about 6000 km.The combination of test areas has been selected to provide representative test results across the Dutch population. The areas selected for the 2022 test account for 5.83 million people, or roughly 34 per cent of the total population of the Netherlands. The test routes are shown on the first page of this report, all visited localities are listed in the box below. The two drive-test cars were equipped with arrays of Samsung Galaxy S21+ smartphones for the simultaneous measurement of voice and data services.
VISITED CITIES AND TOWNS
Cities: Alkmaar, Amersfoort, Amsterdam (W), Deventer, Eindhoven (W), Enschede, Gouda, Groningen, Helmond, Hoorn, Leeuwarden, Leiden (W), Maastricht, Nijmegen, Oud-Beijer- land, Ridderkerk, Rotterdam (W), The Hague (s-Gravenhage) (W), Tilburg (W), Utrecht (W), Zwolle
(W) designates walk test cities. A walk test has also been conducted in Dordrecht.
Towns: Bergen op Zoom, Boxtel, Den Helder, Doetinchem, Emmeloord, Emmen, Etten-Leur, Gorinchem, Middelburg, Nunspeet, Oldenzaal, Tiel, Venray
VOICE TESTING
One smartphone per operator in each car was used for the voice tests, setting up test calls from one car to another („mobile-to-mobile“).The walk test teams also carried one smartphone per operator for the voice tests. In this case, the smartphones called a stationary (smartphone) counterpart. The audio quality of the transmitted speech samples was evaluated using the HD-voice capable and ITU standardised so-called POLQA wideband algorithm. All smartphones used for the voice tests were set to “5G preferred“ mode. In addition, they were set to “VoLTE preferred“. As Voice over 5G/Voice over New Radio is not yet supported in current 5G networks, this means that the devices would perform a fallback from 5G to 4G in order to establish voice calls.In the assessment of call setup times we also rate the so-called P90 value. Such values specify the threshold in a statistical distribution, below which 90 per cent of the gathered values are ranging. For speech quality, we publish the P10 value (10 per cent of the values are lower than the specified threshold), because in this case higher values are better.In order to account for typical smartphone use scenarios during the voice tests, background data traffic was generated in a controlled way through injection of data traffic (HTTP downloads). In the process, we also recorded MultiRAB connectivity – the use of several “radio access bearers“ for the background data connections.The voice scores account for 30 per cent of the total results.
A special control system monitors the smartphones and logs the measurement values they collect.
DATA TESTING
Data performance was measured by using three more Galaxy S21+ in each car – one per operator. Their radio access technology was also set to 5G preferred mode.For the web tests, they accessed web pages according to the widely recognised Alexa ranking.In addition, the static “Kepler” test web page as specified by ETSI (European Telecommunications Standards Institute) was used. In order to test the data service performance, files of 10 MB for download and and 5 MB for upload were transferred from or to a test server located in the cloud. In addition, the peak data performance was tested in uplink and downlink directions by assessing the amount of data that was transferred within a seven seconds time period.The Youtube measurements take into account the “adaptive resolution“ of the video platform: Youtube dynamically adjusts the played resolution to the available bandwidth. The rating therefore considers the average image resolution or number of lines of the videos. In addition, the video rating is based on the success rate, the time until playback starts and the proportion of video playbacks that went through without interruption.All the tests were conducted with the best-performing mobile plan available from each operator. Data scores account for 45 per cent of the total results.
CROWDSOURCING
Additionally, umlaut conducted crowd-based analyses of the Dutch networks which contribute 25 per cent to the end result. They are based on data gathered between calendar week 34 (end of August), 2021, until calendar week 5 (early February), 2022. In the process, a total of 399 million samples from more than 112,509 users were evaluated. The area of the Netherlands covered by these crowdsourcing analyses counts approx. 36,7590 square km and 98.9 per cent of the country‘s built-up areas, which correspond to approx. 99.8% of the population.For the collection of crowd data, umlaut has integrated a background diagnosis process into more than 1000 diverse Android apps. If one of these applications is installed on the end-user’s phone and the user authorizes the background analysis, data collection takes place 24/7, 365 days a year. Reports are generated for every hour and sent daily to umlaut‘s cloud servers. Such reports occupy just a small number of bytes per message and do not include any personal user data.This unique crowdsourcing technology allows umlaut to collect data about real-world experience wherever and whenever customers use their smartphones.
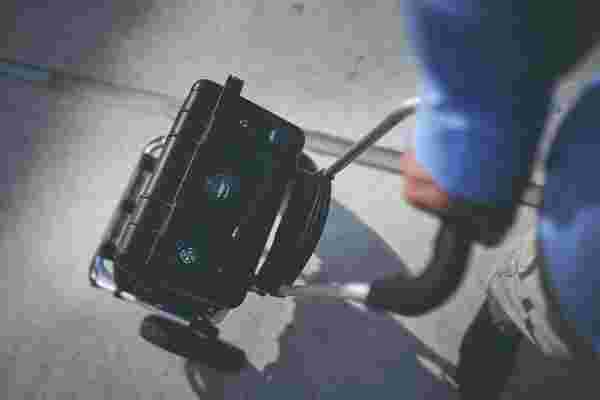
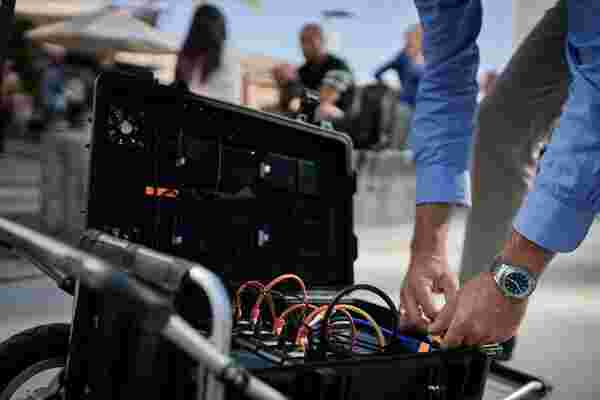
The walktest teams use trolleys in which powerful rechargeable batteries feed the test smartphones.
NETWORK COVERAGE
In order to assess the “Coverage Reach“, the test area is divided by a grid of 2x2 km tiles (“Evaluation Areas“ or EAs for short). A minimum number of users and measured values must be available for an EA to be considered in the analysis.For the evaluation, umlaut awards one point per EA if the network under consideration offers 3G coverage. Three points are awarded if 4G or 5G is avail- able in the EA. The number of points achieved in this way is then divided by the total number of points that can be achieved (three points per EA in the “common footprint“ – i.e. the area of the country covered by all tested operators).In addition, we look at the “Coverage Quality“. It puts the percentage of EAs in which a user had 4G or 5G coverage in relation to all EAs in the common footprint.A third KPI for broadband quality is “Time on Broadband“. It tells us how often an individual user had 4G or 5G reception in the period under consideration – regardless of the EAs in which the samples were recorded. For this purpose, umlaut sets the samples that show 4G/5G coverage in relation to the total number of all samples. Important: The percentage values determined and published for all three parameters reflect the respective degree of fulfilment – they do not correspond to the percentage of 4G/5G mobile coverage in an area or in relation to the overall population.
DATA RATES AND LATENCIES
The data rates determined are included in the crowd score at 30%, the latencies at 20%.The investigation of these parameters is also carried out independently of the EAs and thus concentrates on the experience of each individual user. Samples that were recorded via WiFi or when flight mode was activated, for example, are filtered out before further analysis. In order to take into account the fact that many mobile phone tariffs throttle the usable data throughput, umlaut has defined three application-related speed classes: “Basic internet“ requires a minimum of 2 Mbps, “HD video“ requires 5 Mbps and “UHD video“ requires 20 Mbps. For a sample to be valid, a minimum amount of data must also have flowed in a 15-minute period. Similarly, the latency of the data packets is also assigned to an application-related class: Roundtrip times up to 100 ms are sufficient for “OTT voice services“, less than 50 ms qualify a sample for “gaming“.In the evaluation, umlaut assigns the speeds and latencies determined in the samples to one of these classes. “Basic internet“ then accounts for 55 per cent of the data rate rating, “HD video“ for 33.8 per cent and “UHD video“ for 11.3 per cent. “OTT voice“ services account for 55 per cent of the latency rating and gaming for 45 per cent.

Conclusion
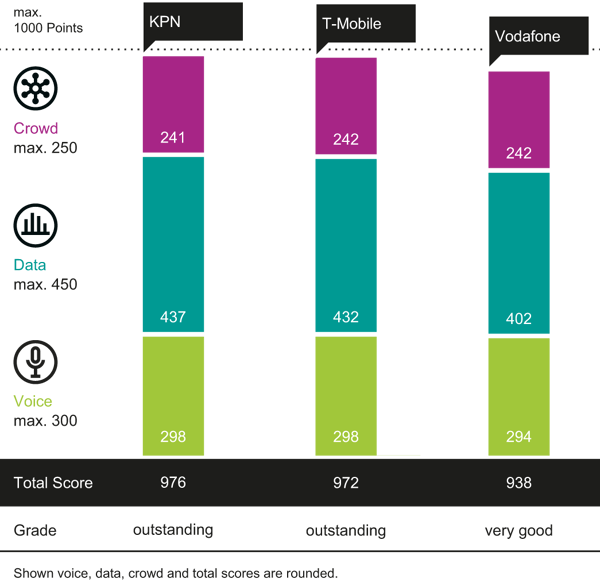
KPN wins the umlaut connect Mobile Benchmark in the Netherlands for the first time and reaches the highest score ever achieved in the Netherlands so far. T-Mobile, who had won five times in a row before, ranks second this year at a narrow gap in a neck and neck race. Both KPN and T-Mobile achieve the impressive grade “outstanding“. As in our previous benchmark, Vodafone comes in third with the grade “very good“.
The overall winner of the 2022 umlaut connect Mobile Benchmark in the Netherlands is KPN. In a neck and neck race on a very high technological level, this year KPN manages to outscore the also extremely strong T-Mobile, which had won the previous umlaut connect Mobile Benchmarks in the Netherlands five times in a row. Both operators deservedly achieve the rare grade “outstanding“. In a comparison to the results of our previous Benchmark in the Netherlands, which was published at the end of 2020, KPN achieves the biggest score improvement by gaining another 22 points. Its overall lead is particularly won in the data category. As we regularly update our methodology and threshold values in order to keep pace with the technological advancements, KPN‘s score gain is even more impressive. But also the second-ranking T-Mobile managed to improve its score over its previous results by an impressive 10 points. Vodafone achieves a very good result, but basically remains at its previous performance level, which results in losing 7 points due to the increased demands of our updated methodology.

1
For the first time, KPN is the winner of our Mobile Benchmark in the Netherlands. It deservedly achieves the rare grade “outstanding“, scored highest in the data category and also leads in the voice category, together with T-Mobile. KPN is also ahead in terms of 5G coverage in the bigger Dutch cities.

2
The second-ranking T-Mobile scores four points behind the overall winner and also achieves the rare grade “outstanding“. The operator is ahead in the crowd category together with Vodafone and scores on a par with KPN in the voice discipline. T-Mobile also provides the highest share of 5G coverage in towns. on roads and on railways.

3
Vodafone ranks third with a very good result. It scores relatively close to its competitors in the voice category and leads together with T-Mobile in the crowd category. The third place is obtained mainly due to a slight drop in performance in the data discipline. In 5G, Vodafone offers good coverage and performance KPIs.
Container for the dynamic page
(Will be hidden in the published article)